I made an attempt to optimize lineup fit using the talent grades developed by Tim and Jacob at the Bball-Index. These grades use publicly-available stats to provide objective measures of skill that are designed to be independent of team-specific factors such as coaching, schemes, and teammates. For this project, I used six seasons of talent grades for the following skills: 3-point shooting, off-ball movement, playmaking, 1-on-1, roll gravity, finishing, post play, rebounding, perimeter defense, and interior defense. I linked these talent grades with six years of play-by-play data from PBPstats.com (70k lineups, 1.4M possessions) to find out which skills are synergistic and which are redundant.
One immediately apparent challenge of optimizing lineup fit is that the players who have the skills needed to create a high-powered offense often lack the skills necessary to build a stingy defense (and vice versa), as we see from this grid of correlation coefficients between individual talent grades.

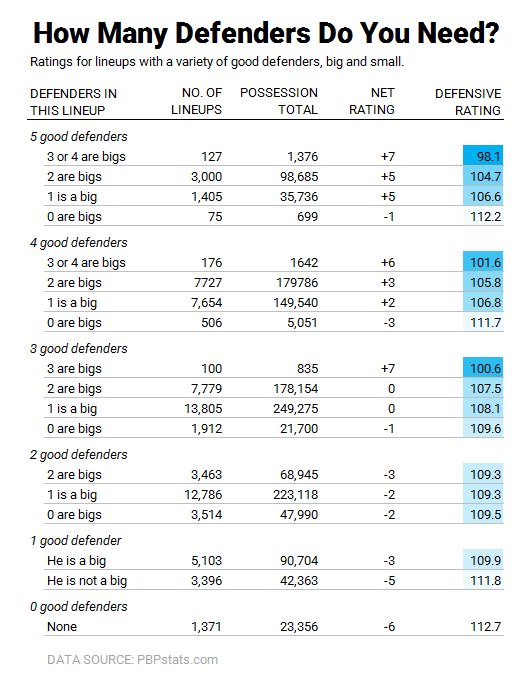
So how many good defenders should we have on the court at once then? Let’s say that we’ll consider any big man to be a “good” defender if his interior defense grade was an “A” or a “B” (i.e., in the top 40 percent of the league) and we’ll consider any perimeter player to be a “good” defender if his perimeter defense grade was an “A” or a “B” then we can look at how many “good” defenders it takes to make a sturdy defensive lineup.
Next I used k-means clustering (kmeans in R) to group players into 12 archetypes using their percentile ranks in the talent grades. Below you can find the average talent grades for each of the 12 types of player.

To figure out which of these player types form effective combinations within lineups I evaluated 3 multivariable models — for net, offensive, and defensive ratings. For explanatory variables, I counted up the number of players from each archetype that were found in each lineup and estimated the linear relationship between archetype counts and lineup ratings. These models provide mutually-adjusted estimates of the effect of adding one additional player from a particular archetype to a lineup. Finally I evaluated 2-way interactions between player types to describe how different kinds of players might fit together.

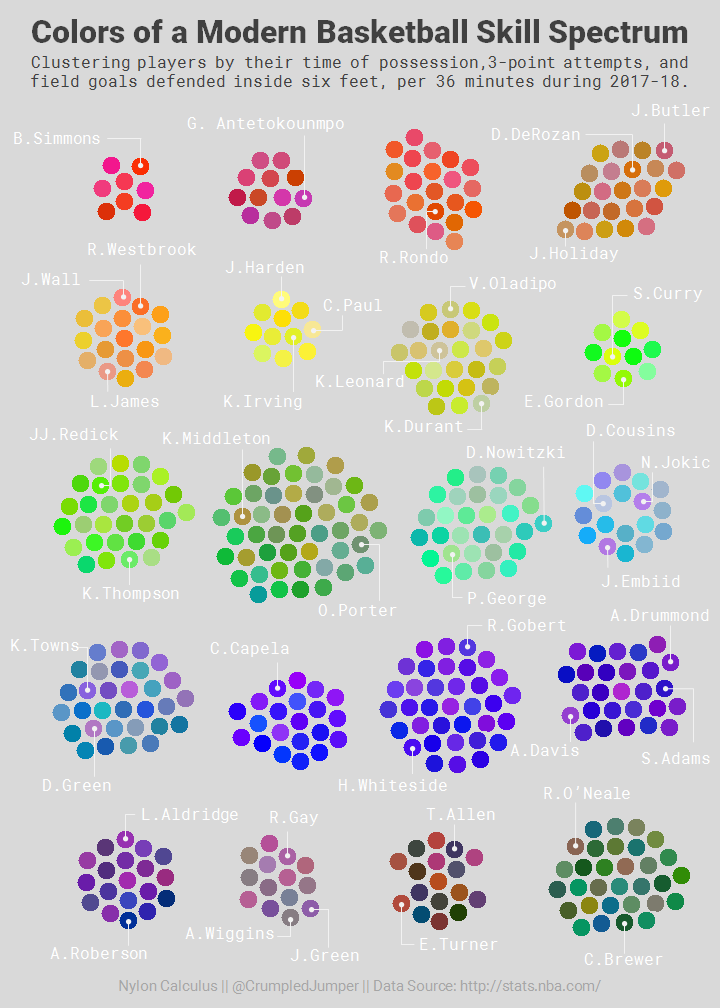
For a previous project on lineup fit, I clustered players using three per-36-minute stats that are decent surrogates for the three dimensions of modern basketball skill – minutes of ball possession (red), 3-point attempts (green), and field-goal attempts defended inside 6 feet (blue) – and plotted the groups using the RGB color model.
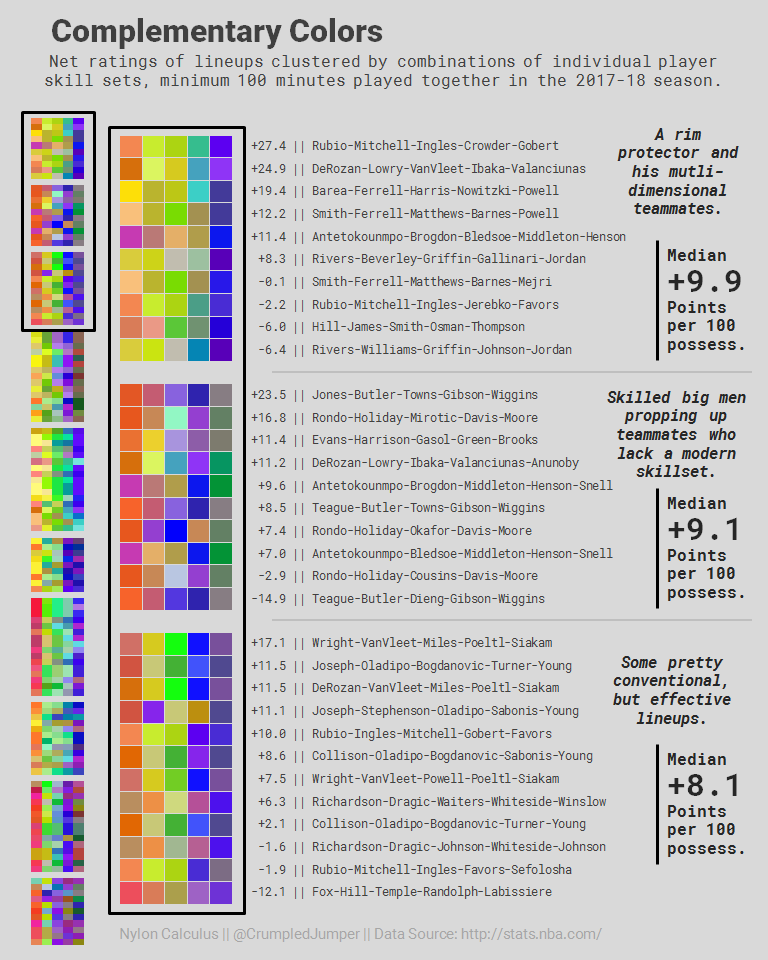
Next, I organized the players into 127 five-man units that played together for at least 100 minutes each during the 2017-18 season. I used k-means clustering to group lineups into similar-looking five-color combos. Then, I tabulated the median net rating for each grouping of clustered lineups. These were the best lineup structures:
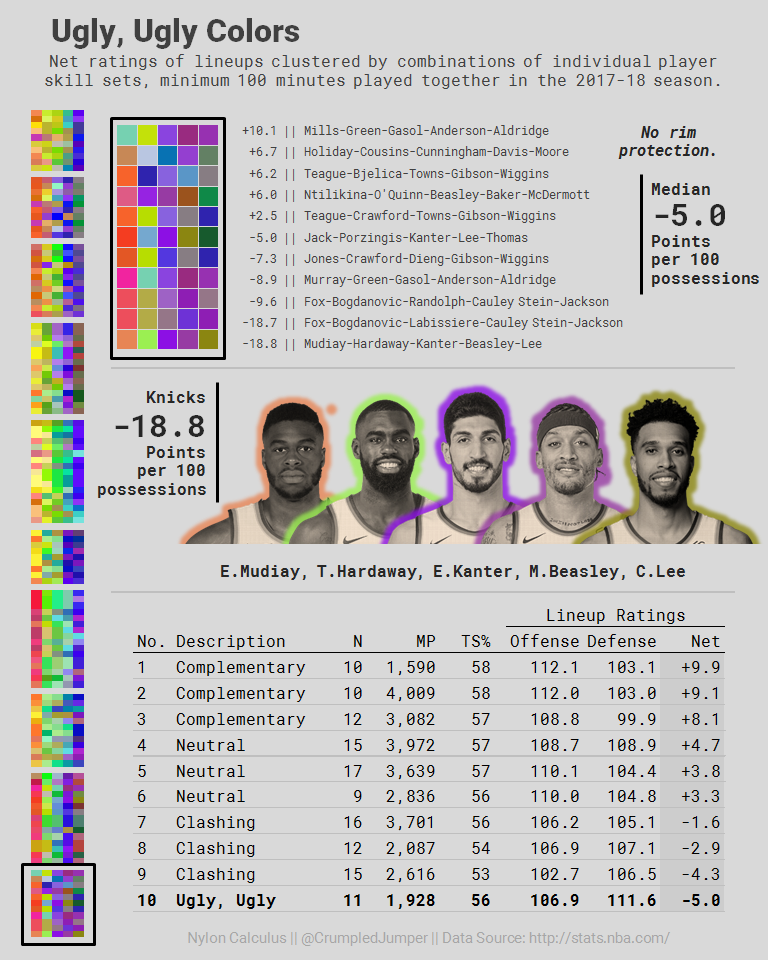
These were the worst lineup structures:
I matched up player height and reach data from the NBA combine with lineup data and then tested the relationships between average lineup height and defensive rating. I shared my findings in The Athletic – Bay Area, in a story called “The Warriors have revolutionized small ball, but are they really small?” For the 2016-17 season, I found there was no relationship between a lineup’s average height and its defensive effectiveness (quantified by the number of points the opponents scored per 100 possessions).
But, unlike average height, variance in height was the best indicator of a lineup’s defensive capabilities last season — that is,
Units that were comprised of players who were of similar size tended to allow fewer points.
The Warriors “small”-ball lineups were comprised of players with small ranges in height.

This seems to have translated to an effective switch-heavy defense in Golden State.

Check out more useful projects.
