I used hand-tracked player locations to examine two different approaches that NBA teams are using to balance offensive rebounding and transition defense.
For 16 games featuring the Lakers or the Thunder I cataloged three types of rebounds: (1) offensive rebounds; (2) defensive rebounds that led to an opponent fast break (i.e. possession length of 6 seconds or less); or defensive rebounds that led to half-court possession (i.e. possession of 12+ seconds) then hand-tracked player locations at two points in time: (1) when the shot was released and (2) when the rebound was gathered.
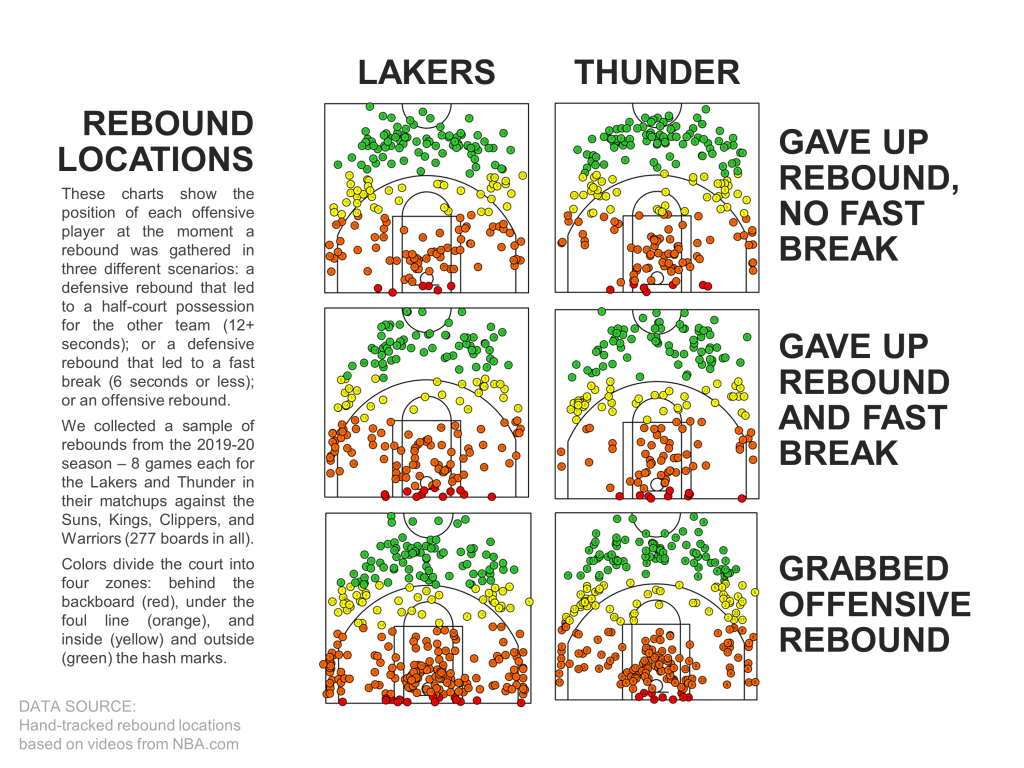
I sorted player locations by 4 court sections: (1) behind the backboard (in red); (2) under the foul line (in orange); (3) inside of the hash marks (in yellow); and outside of the hash marks (in green). The Thunder consistently got back on defense, even when they failed to stop the fast break; whereas the Lakers occasionally used an aggressive offensive rebounding strategy which had the tendency to result in them giving up fast breaks.

I tried to use this rebounding tracking data to come up with actionable tips for coaches. How often did each team have three players in the green zone at the moment the ball was rebounded? How much did having three players in the green zone decrease a team’s odds of giving up a fast break?
When the Lakers had three guys back in the green zone before the ball was rebounded by the other team, they were 3.2 times as likely to play good transition defense as they were to allow a fast break.

When I broke the rebounding tracking data out by specific players I found that both teams have one dedicated “crasher” (Howard, McGee, Adams, or Noel) on the court, but the Lakers were more likely than the Thunder to also have a “shooter” (i.e. anybody else) in the orange/red zones during a rebound, especially when that rebound led to a fast break (45% vs. 26%). It wasn’t so much that the Lakers were sending more players to the glass as it was them just not sending players back immediately.

With the help of an ambitious rebound-tracking project started by Darryl Blackport I tried to untangle the relationships between shot distance, rebound distance, and the probability of an offensive rebound. Blackport has logged the coordinates of thousands of missed shots along with the coordinates of all the resulting rebounds.
The chart below summarizes the results of 1783 missed 3-pointers in the rebound tracking database — how far did the rebounds travel and which team grabbed them once they got there?

Check out more useful projects.
