To predict how Kevin Durant will bounce back from his ruptured Achilles tendon I examined the league’s recent history with this injury. I searched the Pro Sports Transactions archive to find all of the season-ending Achilles tendon injuries since the 2000-01 season (N=40) to model the shape of performance recovery curves and try to anticipate how Durant may be forced to change his game in the future.
I ran mixed-effects models that relate the number of minutes a person played in a given season to his years of experience, the calendar year, and his injury status (ie, in the year of an Achilles injury, 1 year after his injury, or 2 to 5 years after his injury). The model defines a common shape of the aging curve for any NBA player but with a different amplitude defined for each individual and it allows us to see the impact — in terms of minutes lost — of an Achilles injury. Similarly, I created four skill-specific aging curves for at-rim frequency, at-rim accuracy, 3-point frequency, and 3-point accuracy. Using these models I predicted how many minutes Durant will play during each of his next five seasons as well as looking at how often and how well he might shoot at the rim and from the 3-point line.
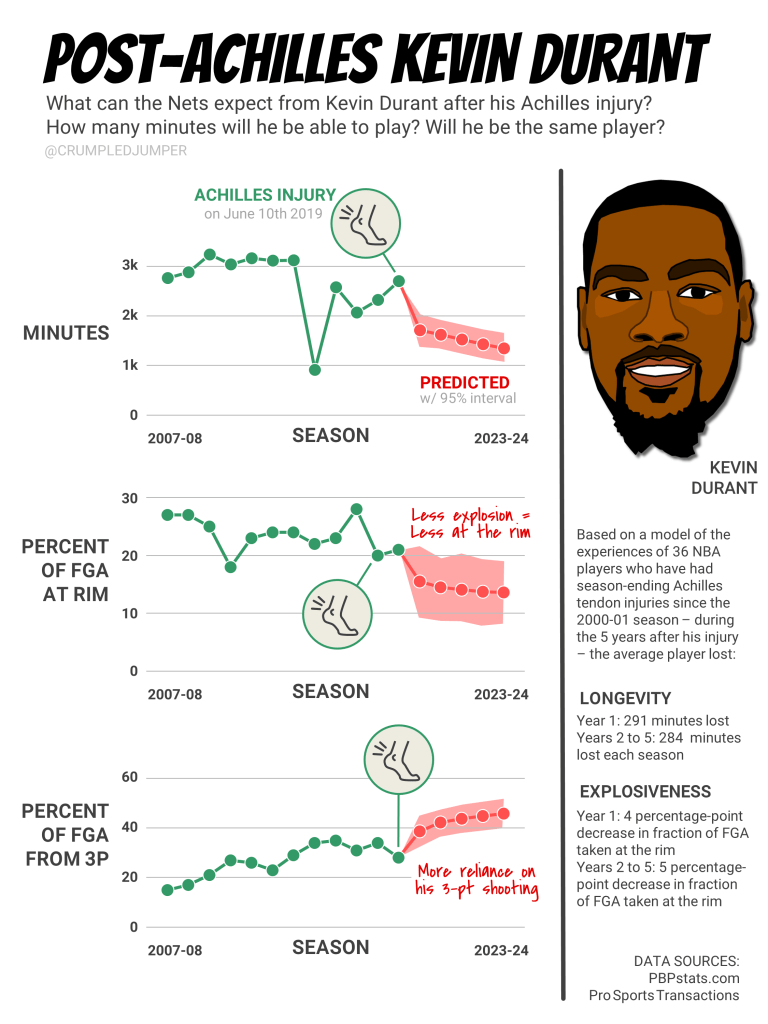
My models found that an Achilles injury cost a player an average of 291 minutes the following year and that the playing-time deficits persisted over the course of the next four years. Interestingly, Achilles injuries were linked to decreases in the percent of field goal attempts at the rim in the following year (four percentage points lower than would be expected with healthy aging) as well as over the next four years (five percentage points lower), presumably due to lost explosiveness. Correspondingly, players that suffered Achilles injuries tended to take a larger fraction of their shots behind the 3-point line.

Inspired by some historical data viz created by James Naismith for his 1927 paper, ‘Is Basketball Injurious?’ this chart updates the theme, asking: how did rest days and injuries impact one NBA player’s energy level, using publicly-available tracking data.

Embiid’s chart shows a gradual relaxation of the Sixers load management program from the beginning of the season to the end. Through January 2018 you will find ZERO examples of side-by-side colored bars, indicating that Embiid did not play any back-to-back games during that stretch. After the All-Star Game, as the Sixers maneuvered for playoff position, Embiid’s rest pattern condensed. He played 18 games in 32 nights including appearances in four pairs of back-to-back games. This run was characterized by some sluggish play from Embiid as you can see from his tracking data — 11 red bars, 5 yellow bars, and just 2 green bars.
For a more definitive answer to Naismith’s question of whether basketball is injurious, we may yet require even better data. The stats on distance traveled — at least in the form that is available to the public — are probably not sufficient to link rest days to activity level or injury prevention in a rigorous way.
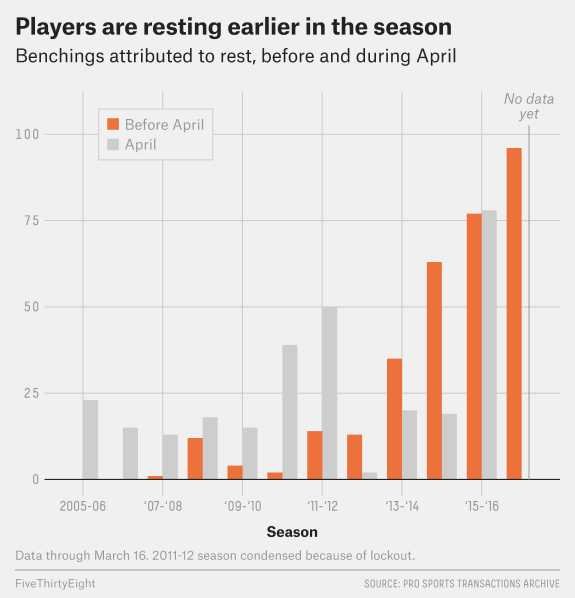
For FiveThirtyEight I wrote about trends in the number of games missed for “rest”. The graphics team helped me create this chart showing the increased frequency of DNP-Rest designations during the early part of the season from 2006 to 2017.
Check out more useful projects.
