I used a really simple simulation to illustrate how regression to the mean could fool coaches into believing in the power of punishment. Consider the distribution of single-game free-throw percentages of the Miami Heat, the worst foul shooting team in the league during the 2018-19 season. They averaged 69% from the line during that year with single-game free-throw percentages as low as 26% and as high as 94% (reflecting a standard deviation of 11%). By sampling at random from a normal distribution with a mean of 69% and a standard deviation of 11% we can simulate how such a team’s foul shooting might vary from game to game.
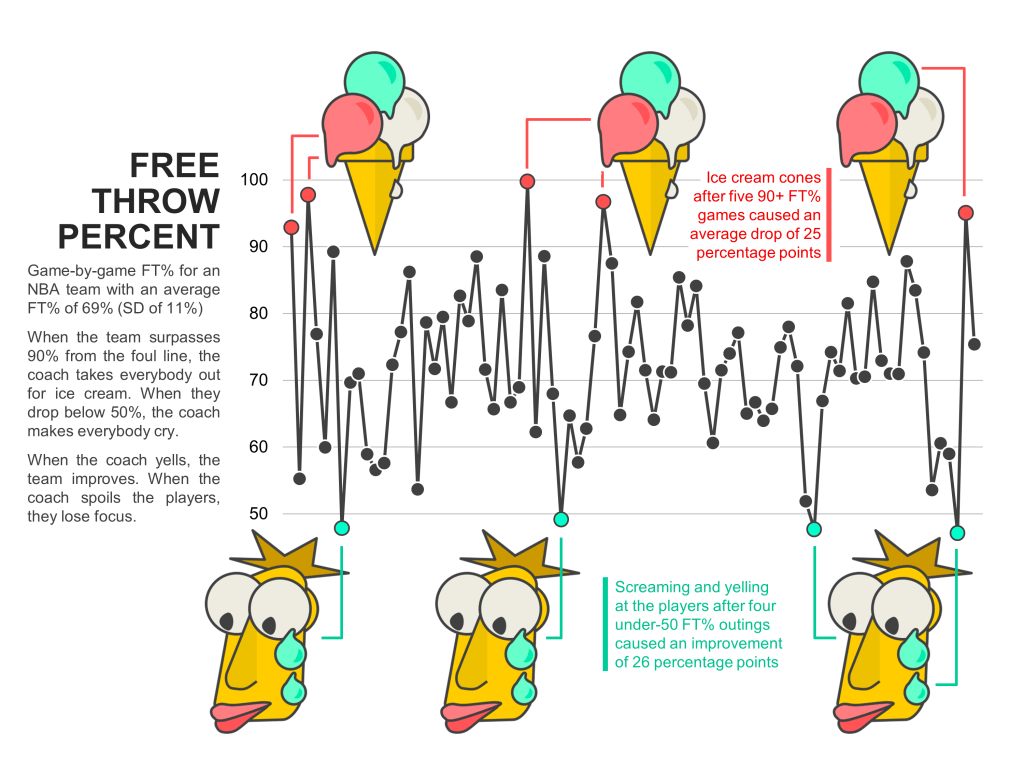
In this simulated season, Miami’s foul shooting dropped below 50% four times and — after some yelling and screaming from our imaginary coach Erik Spoelstra — the team improved every time. You can see from this demonstration how random fluctuations in performance could be misconstrued as a validation of punishment.

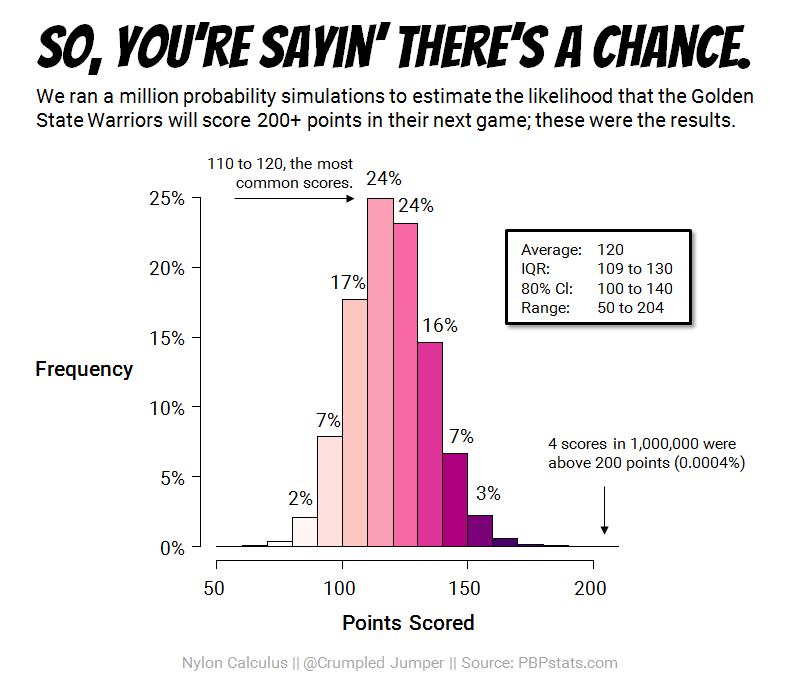
Would it have been possible for the 2019 Warriors to score 200 points in a single game? To find out, I set up a probability-based simulation of the Warriors scoring and tested it one million times to see if I could find any plausible scenario in which they would score 200 points.

Click on the image above to sift through the first 10,000 simulated games in Tableau and look at how Stephen Curry, Kevin Durant, and Klay Thompson shot. This histogram summarizes the game results:
I set up a program to simulate how Klay Thompson’s career would have played out in a universe where the hot hand does NOT exist. Using rbinom in R I generated random 1s and 0s from the binomial distribution to represent his 3-point makes and misses, reproducing his career 42% shooting from deep. I plugged in Thompson’s actual log of 3-point attempts by game (a range from 0 to 24 3PA) and then simulated the first 600 games of his career 10,000 times. This simulation process gives us a sense for the range of possible outcomes in a world without the hot hand which we can compare to Thompson’s actual career shooting.

For FiveThirtyEight I simulated NCAA tournament upsets based on average efficiency margin per possession and the number of possessions played (i.e., the pace of play).

Check out more useful projects.
